Abstract
总结一下sashimi plot相关的方法,找一个最适合我现在状况的方法。
What is sashimi_plot?
Sashimi plots first appeared as a part of the MISO package developed by Katz et. al. in 2010. They allow for the easy comparison of read depth, alternative splicing, and isoform structure between individual RNA-seq samples.
This introduction comes from SplicePlot
现存的几种方案
MISO
Installation & Dependencies
MISO whole package,
which could be installed using conda1
conda install -c bioconda misopy
sashimi_plot itself only requires Python package matplotlib(version 1.1.0 or higher) as well as samtools
Usage & Materials needed
- GFF file recording the informations of your alternative events
- setting.txt
- bam_files
- miso_files
- plot settings
- Bayes factors thresholds for –plot-bf-dist
Inputs require a gff file of the alternative events, which has to be indexed in order to be used with MISO with the index_gff script.
plot a event by running following command line from within the sashimi_plot directory in MISO:1
sashimi_plot --plot-event "chr17:45816186:45816265:-@chr17:45815912:45815950:-@chr17:45814875:45814965:-" test-data/event-data/ settings/sashimi_plot_settings.txt --output-dir test-plot
the event name is listed in the GFF file
The paper) for stand-alone sashimi plots was published in 2015.
Output example
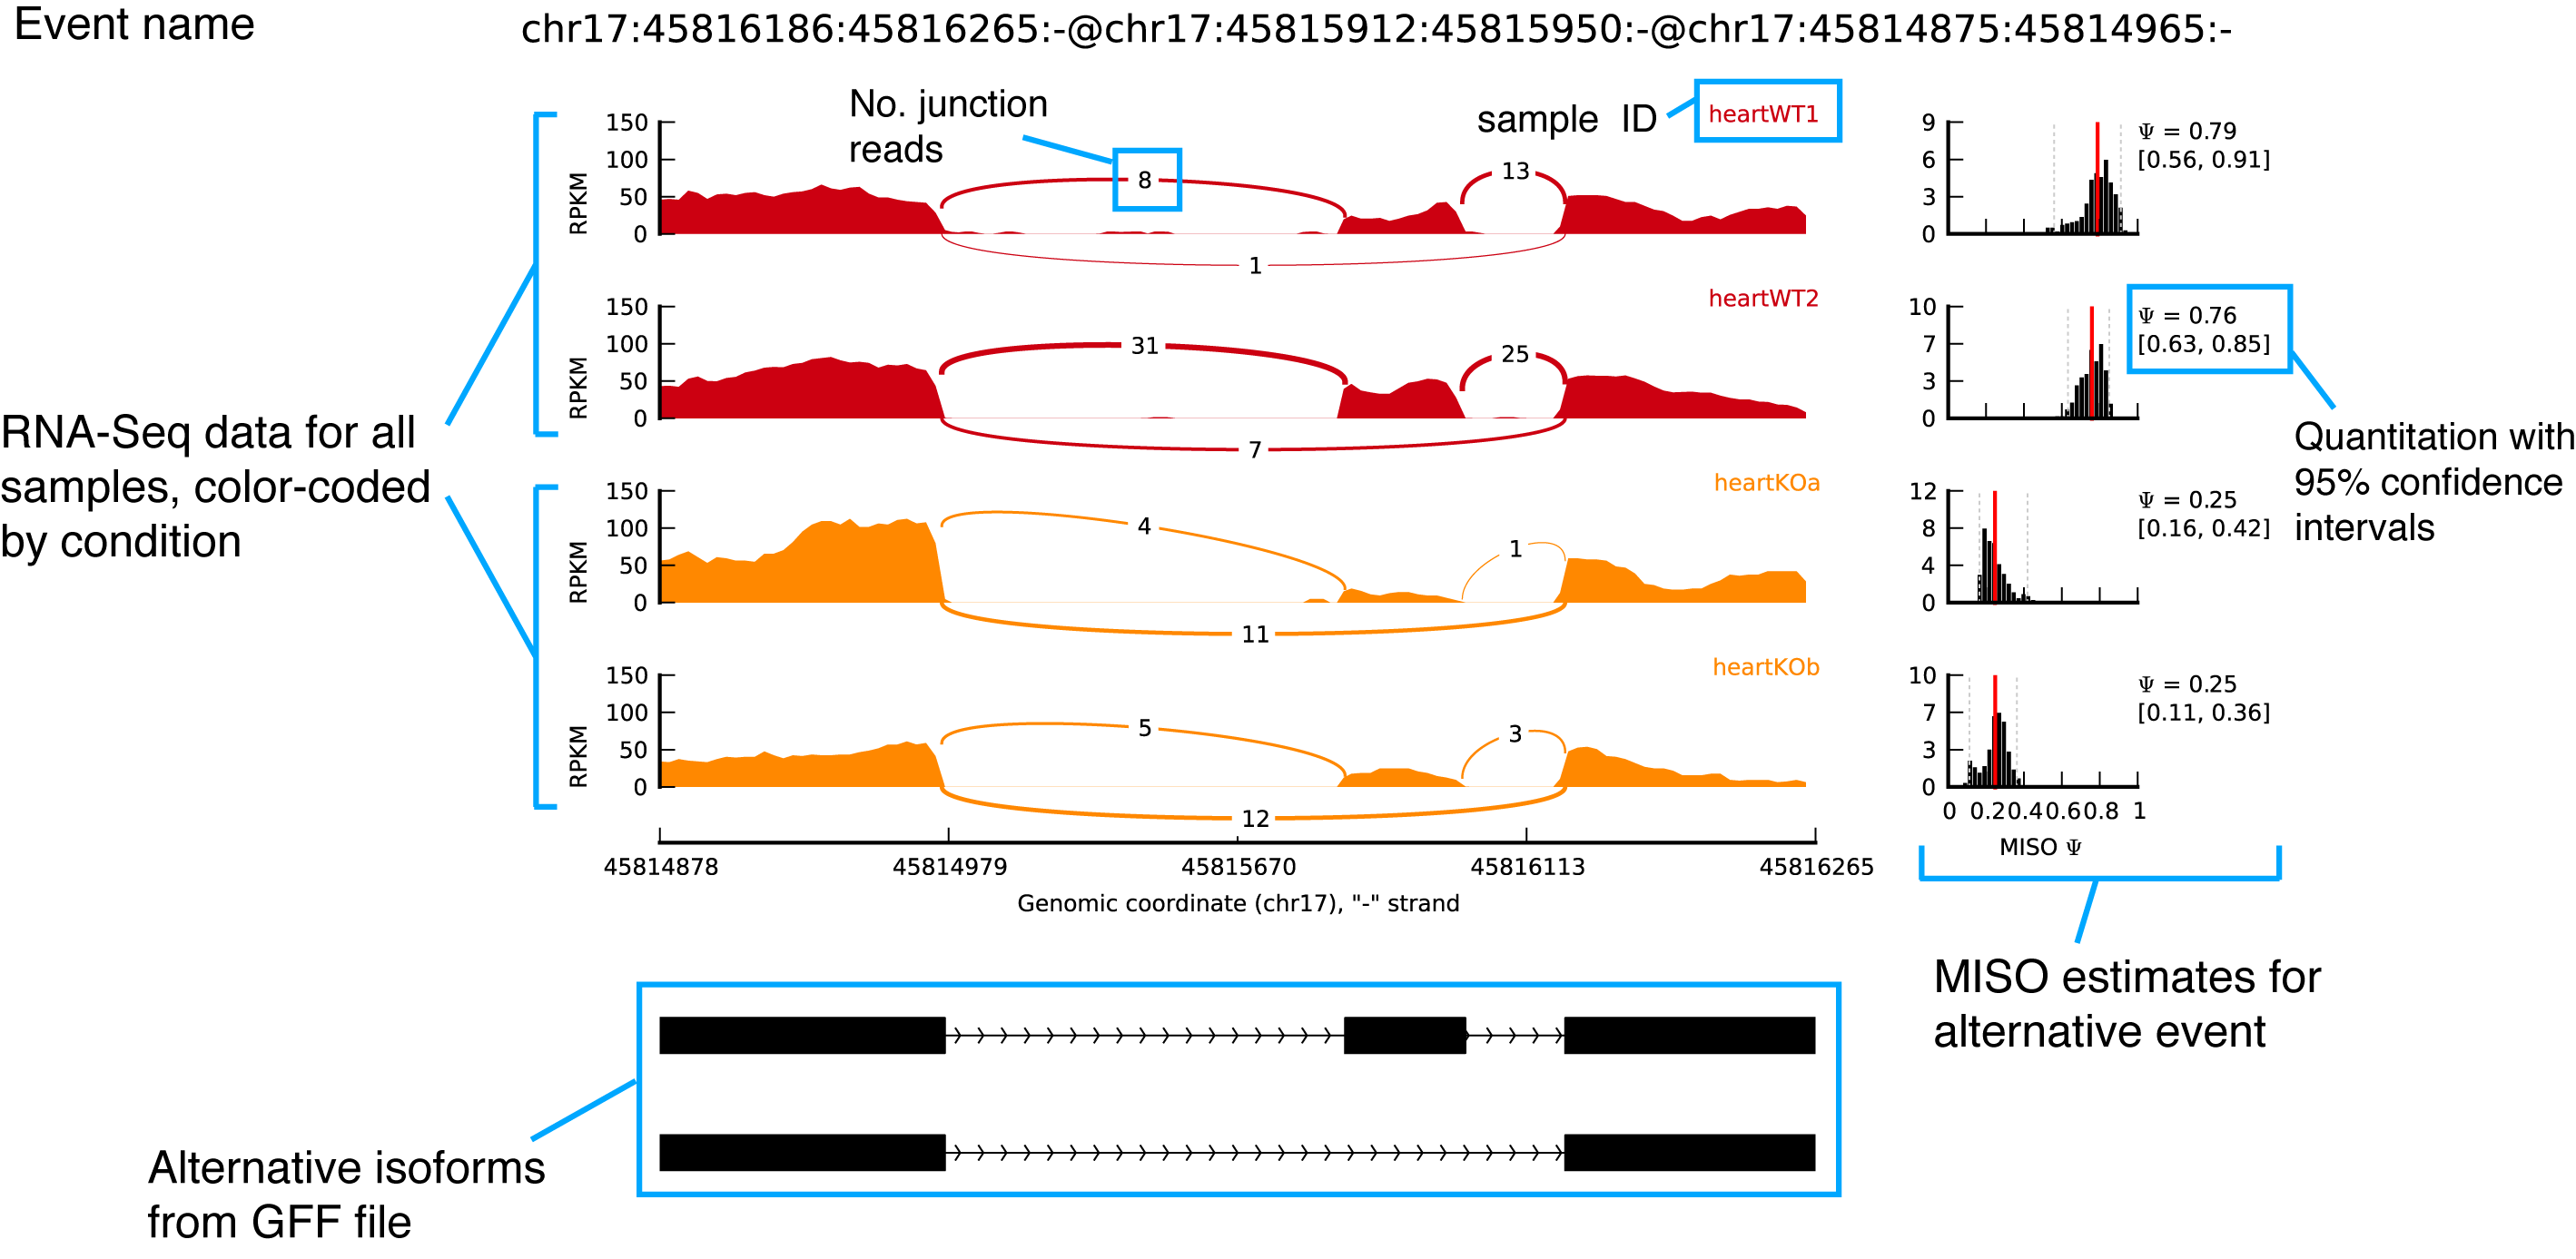
Noted that the junction connections were quantified and displayed by junction reads number.
Comments
Since the inputs require MISO output, it means that
I have to run the whole packages all over. Cannot just plot from bam files.
Not specifying the miso_files or specifying any directory that does not contain MISO files (or a value like “None”) should work.
IGV
Installation & Dependencies
Download the software here.
Need igvtools or samtools to generate index files for each bam.
Usage & Materials needed
软件可以直接操作看,也可以使用batch script控制
控制命令参考Controlling IGV through a Port
但关于sashimi plot的操作似乎还是通过MISO的python 脚本来实现的
For scripting I recommend you use the original sashimi plot: https://miso.readthedocs.io/en/fastmiso/sashimi.html
igv-documentation for Sashimi plot
Static images of Sashimi plots can also be generated outside IGV with sashimi_plot, a Python tool which is part of the MISO package. Read more about sashimi_plot here.
Output example

Comments
不能使用脚本控制
或者还是得调用MISO那一套
SplicePlot
Installation & Dependencies
Python requirements:
- Python 2.6 or newer . If running Python 2.6, download and install the argparse module
- numpy version 1.7.1 or newer
- scipy version 0.11.0 or newer
- matplotlib version 1.2.0 or newer
- pandas version 0.11.0 or newer
- pysam version 0.7 or newer
Other requirements:
- SAMtools must be installed and be in your $PATH
- Tabix must be installed and be in your $PATH
- Install the above dependencies.
- Download the SplicePlot .zip and unpack the archive in the desired directory
- Check if all of the necessary Python packages are available by running the command python check_module_availability.py in the SplicePlot directory.
Cannot be found on conda cloud.
Usage & Materials needed
Details are shown here.
Input files:
- A .vcf which has been sorted, bgzipped, and indexed using tabix.
- A .gtf annotation file containing only exons which has been sorted by position, bgzipped, and then indexed using tabix.
- .bam files containing the aligned RNA-seq data.
- A mapping file which assigns the individual IDs from the .vcf to file paths for the .bam files as shown below.
1
2
Individual_ID /path/to/bam/file.bam
Another_ID /path/to/other/bam/file.bam
Output example

Noted that the exon connections are presented as splicing ratio, which is calulated as:
And the package can also print out hive-plots and Structure-plots
Comments
The updates stop at 2013.
The package was built under python 2.x
Exploring
Create a conda environment for sashimi
1 | conda create -n sashimi python=2.7 |
Splice Plot
Test
To test SplicePlot, run the command
python plot.py test_files/test.p pickle settings_filein the SplicePlot directory.
Something’s wrong…1
2
3
4
5
6
7
8
9#> Reading settings from settings_file...
#> Parsing settings for hive plot...
#> Parsing settings for structure plot...
#> Parsing sashimi plot settings...
#> Done reading settings.
#> Traceback (most recent call last):
#> File "plot.py", line 111, in <module>
#> data_frame = pickle.load(pickle_file)
#> TypeError: _reconstruct: First argument must be a sub-type of ndarray
Cannot find the pickle file.
说起来真是奇怪为什么一定要写SNP…写junction site不就完了。。
不太懂这个工具的逻辑
MISO: sashimi_plot
find MISO path in conda env ~/anaconda3/envs/sashimi/lib/python2.7/site-packages/misopy/
Test
1 | cd sashimi_plot/ |
Test complete. No errors found.
在自己的数据上进行测试
- prepare bams
- prepare gff/gtf
- prepare setting file
- create a wrapper (currently in R)
Prepare the alternative isoforms annotations for MISO::sashimi_plot
gencode.v27.gtf is fine.
Preparing GFF3
use this script to convert GTFs to GFF3, which needs a .cfg files
I found this template online.
GFF3转换好像需要什么trick…
网上下的gtf2gff3.pl不太好使
于是寄几改了一个别人的gtf2gff3.py脚本1
2
3
4
5
6
7
8
9
10
11
12
13
14
15
16
17
18
19
20
21
22
23
24
25
26
27
28
29
30
31
32
33
34
35
36
37
38
39
40
41
42
43
44
45
46
47
48
49
50
51
52
53
54
55
56
57
58
59
60
61
62
63
64
65
66
67
68
69
70
71
72
73
74
75
76
77#!/usr/bin/python
"""
Convert ensemble gtf to gff3 for MISO:sashimi_plot
Copyright (C)
__Author__: Jason Li
"""
import sys
import re
chr = 'chr'
keep_features = ["CDS", "UTR", "exon", "gene", "transcript"]
if len(sys.argv) < 2:
print("Run:\n\tpython " + sys.argv[0] + " input.gtf output.gff3")
exit()
gtf_file = sys.argv[1]
if len(sys.argv) == 2:
gff_file = gtf_file.rstrip('gtf') + 'gff3'
else:
gff_file = sys.argv[2]
### Parse gtf file
gtf = open(gtf_file, 'r')
gff = open(gff_file, 'w')
gtf_lines = gtf.readlines()
line_num = 0
for line in gtf_lines:
line_num += 1
if re.match(r'^#', line):
continue
featureline = line.strip().split('\t')
[seq, source, feature, start, end, score, strand, frame, attributes] = featureline
if feature not in keep_features:
continue
seq = seq
if feature == 'transcript':
feature = 'mRNA'
attributes_array = attributes.replace('"','').strip(';').split('; ')
attr_dict = dict(map(lambda x: x.split(), attributes_array))
if feature == 'gene':
# if I have time, this should be able to be controled by a config file
geneID = attr_dict['gene_name']
Name = geneID
gff.write(
'\t'.join([seq, source, feature, start, end, score, strand, frame]) + '\t' +
'ID=' + geneID + ';Name='+Name +'\n')
elif feature == 'mRNA':
#count = 0
Parent = geneID
transID = geneID + '.' + attr_dict['transcript_name']
gff.write(
'\t'.join([seq, source, feature, start, end, score, strand, frame]) + '\t' +
'ID=' + transID + ';Parent='+ Parent +'\n')
elif feature == 'exon':
#count += 1
Parent = transID
exonID = transID + '.' + attr_dict['exon_id']
gff.write(
'\t'.join([seq, source, feature, start, end, score, strand, frame]) + '\t' +
'ID=' + exonID + ';Parent='+ Parent +'\n')
else:
pass
if line_num % 10000 == 0:
print "{} lines processed.".format(line_num)
# gff.write(
# '\t'.join([seq, source, feature, start, end, score, strand, frame]) + '\t' +
# 'Parent=' + ID + '\n')
gff.close()
gtf.close()
使用index_gff对这个gff3进行index
报错,找不到某个pickle文件,懒得查错到底是什么,,明明别的都输出的好好的。
在~/anaconda3/envs/sashimi/lib/python2.7/site-packages/misopy/pickle_utils.py的写文件函数里加了个try...except结构1
2
3
4
5
6
7
8def write_pickled_file(obj_to_pickle, pickled_filename):
try:
pickled_file = file(pickled_filename, 'w')
pickle.dump(obj_to_pickle, pickled_file, -1)
#del pickled_file
pickled_file.close()
except Exception,e:
print Exception,":",e
Prepare setting file
经过测试,miso相关的文件完全不需要也可以进行sashimi plot
仅仅需要一些plot相关的参数以及bam的路径以及对应各个样本的颜色信息和总reads信息(for RPKM calculation)
通过测试的minimum setting file looks like this:1
2
3
4
5
6
7
8
9
10
11
12
13
14
15
16
17
18
19
20
21
22
23
24
25
26
27
28
29
30
31
32
33
34
35
36
37
38
39
40
41
42
43
44
45
46
47
48
49
50
51[plotting]
# Dimensions of figure to be plotted (in inches)
fig_width = 7
fig_height = 5
# Factor to scale down introns and exons by
intron_scale = 30
exon_scale = 4
# Whether to use a log scale or not when plotting
logged = True
font_size = 6
# Max y-axis
# ymax = 150
# Whether to plot posterior distributions inferred by MISO
show_posteriors = False
# Whether to show posterior distributions as bar summaries
bar_posteriors = False
# Whether to plot the number of reads in each junction
number_junctions = True
resolution = .5
posterior_bins = 40
gene_posterior_ratio = 5
[data]
bam_prefix = ./bams/
bam_files = [
"heartWT1.sorted.bam",
"heartWT2.sorted.bam",
"heartKOa.sorted.bam",
"heartKOb.sorted.bam"]
# List of colors for read denisites of each sample
colors = [
"#CC0011",
"#CC0011",
"#FF8800",
"#FF8800"]
# Number of mapped reads in each sample
# (Used to normalize the read density for RPKM calculation)
coverages = [
6830944,
14039751,
4449737,
6720151]
Preparing bams/bais
1 | ls $PWD/01.STAR/*/*/*.bam | awk -F "/" '{print $8"\t"$9"\t"$0}' > /path/to/data/sashimi_plot/bams.list |
妈的真是慢啊。。但我又懒得写多核控制shell..啊不其实是不会。。
=== update ===
由于登陆节点真的太慢了所以直接投计算节点了,超快!
版权声明: 本博客所有文章除特别声明外,均采用CC BY-NC-SA 3.0 CN许可协议。转载请注明出处!